Numbers of missing values in each month of the Brest sea surge heights data
BrestSurgeMaxima.
Format
BrestSurgeMissing is a data frame with 162 rows (years 1846 to
2007) and the 12 variables (one for each month of the year). Each value
in the data frame gives the number of days for which the surge height data
were missing in the month in question.
The row names of BrestSurgeMaxima are the years 1946:2007 and the column
names are the abbreviated names of the months.
Source
The dataset Brest in the Renext R package, specifically
Brest$OTmissing. Originally, the source was
https://data.shom.fr/.
References
Deville Y. and Bardet L. (2023). Renext: Renewal Method for Extreme Values Extrapolation. R package version 3.1-4. doi:10.32614/CRAN.package.Renext
See also
BrestSurgeMaxima: Annual maxima surge heights at Brest, France.BrestSurgeDays: Number of days per month in 1846-2007.
Examples
head(BrestSurgeMissing)
#> Jan Feb Mar Apr May Jun Jul Aug Sep Oct Nov Dec
#> 1846 4 0 0 0 0 0 0 0 0 0 0 0
#> 1847 21 0 0 0 0 0 0 0 0 0 0 0
#> 1848 0 0 0 0 0 0 0 0 0 0 0 0
#> 1849 0 0 0 0 0 0 0 0 0 0 0 0
#> 1850 0 0 0 0 0 0 0 0 0 0 0 0
#> 1851 0 0 0 0 0 0 0 0 0 0 0 0
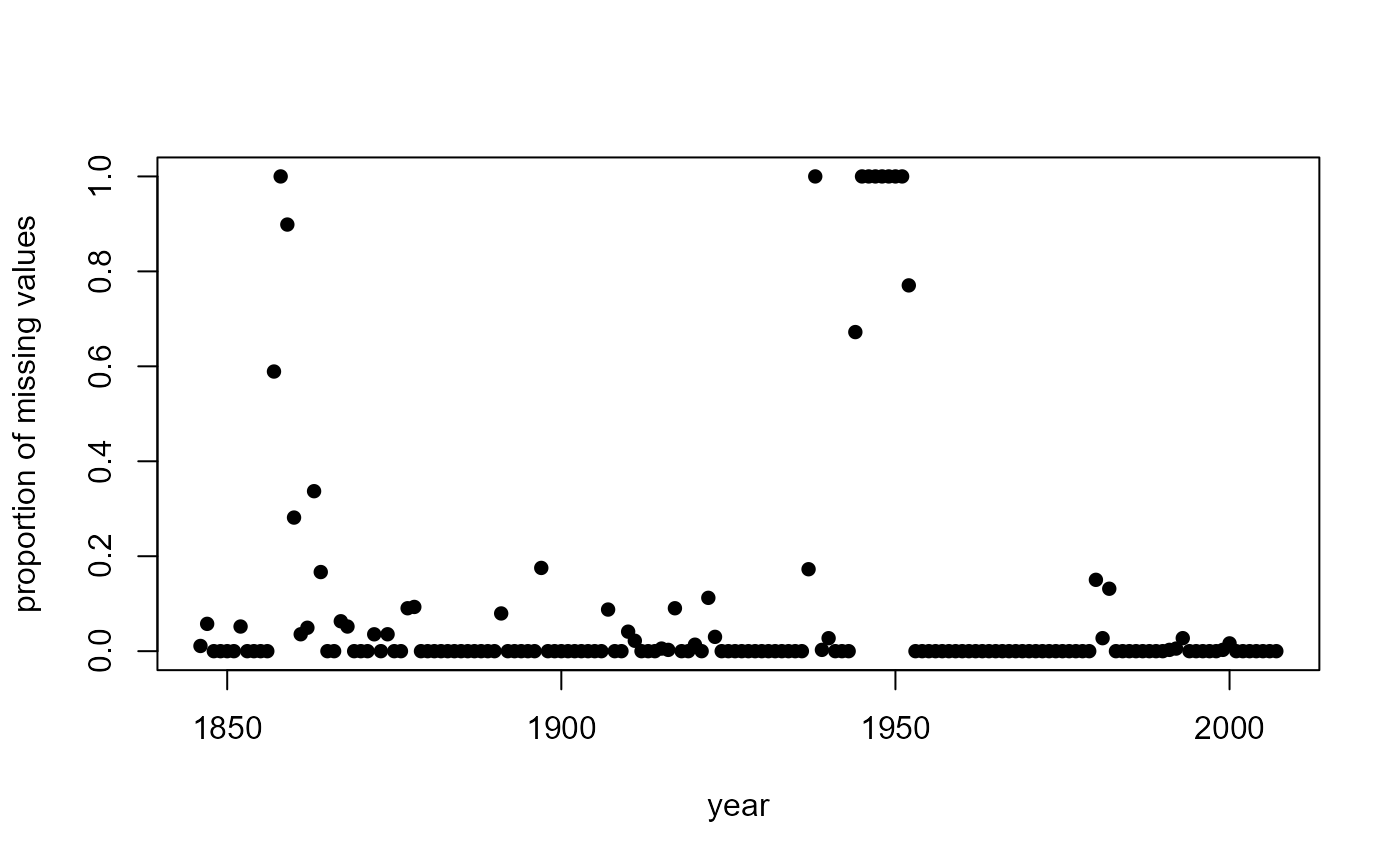
# Proportion of missing values by year
propn_year <- rowSums(BrestSurgeMissing) /
days_in_year(rownames(BrestSurgeMissing))
plot(rownames(BrestSurgeMissing), propn_year,
ylab = "proportion of missing values", xlab = "year", pch = 16)
 # Proportion of missing values by year and month
propn_year_month <- BrestSurgeMissing / BrestSurgeDays
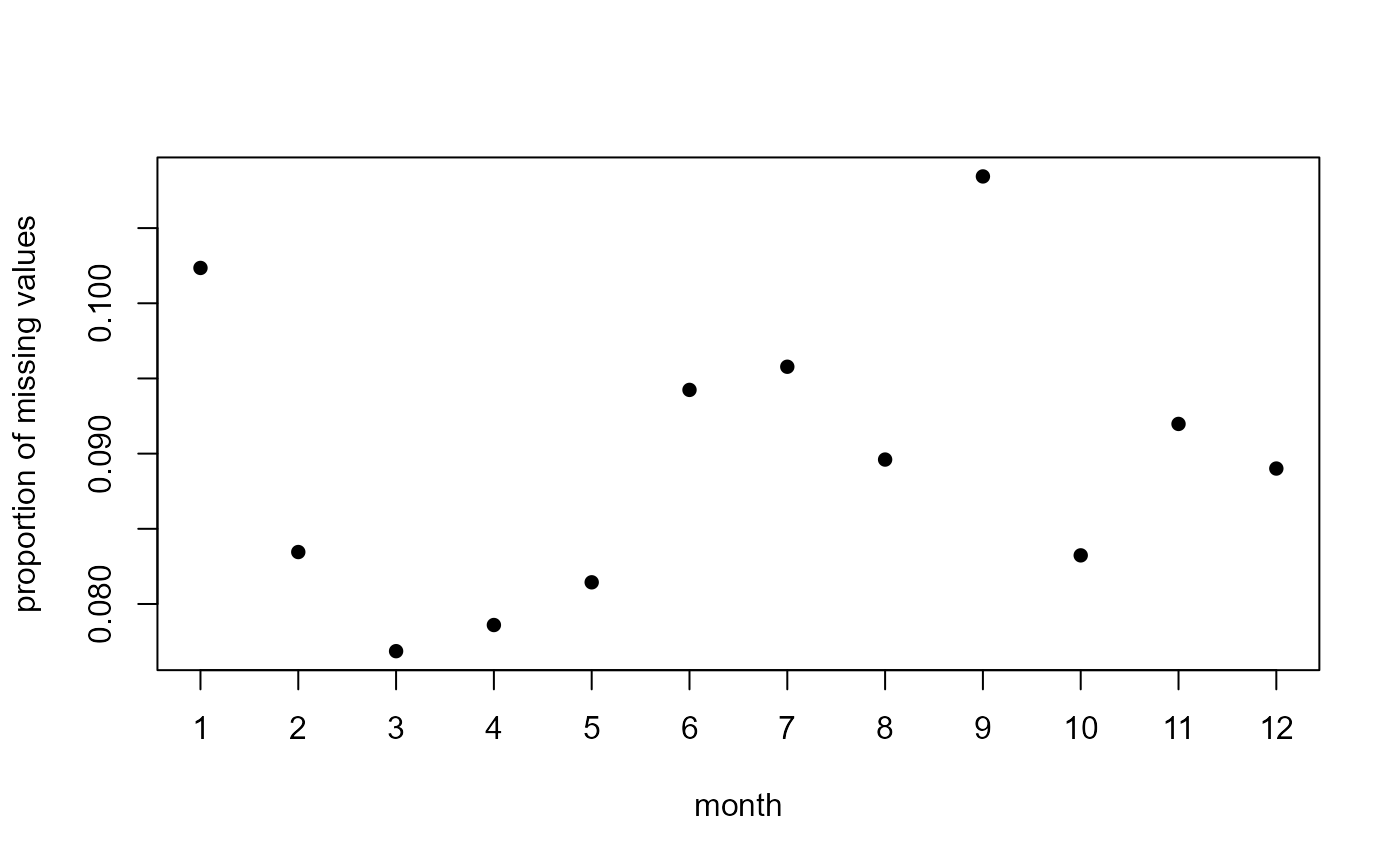
# Proportion of missing values by month
plot(1:12, colMeans(propn_year_month), axes = FALSE,
ylab = "proportion of missing values", xlab = "month", pch = 16)
axis(1, at = 1:12, labels = 1:12)
axis(2)
box()
# Proportion of missing values by year and month
propn_year_month <- BrestSurgeMissing / BrestSurgeDays
# Proportion of missing values by month
plot(1:12, colMeans(propn_year_month), axes = FALSE,
ylab = "proportion of missing values", xlab = "month", pch = 16)
axis(1, at = 1:12, labels = 1:12)
axis(2)
box()