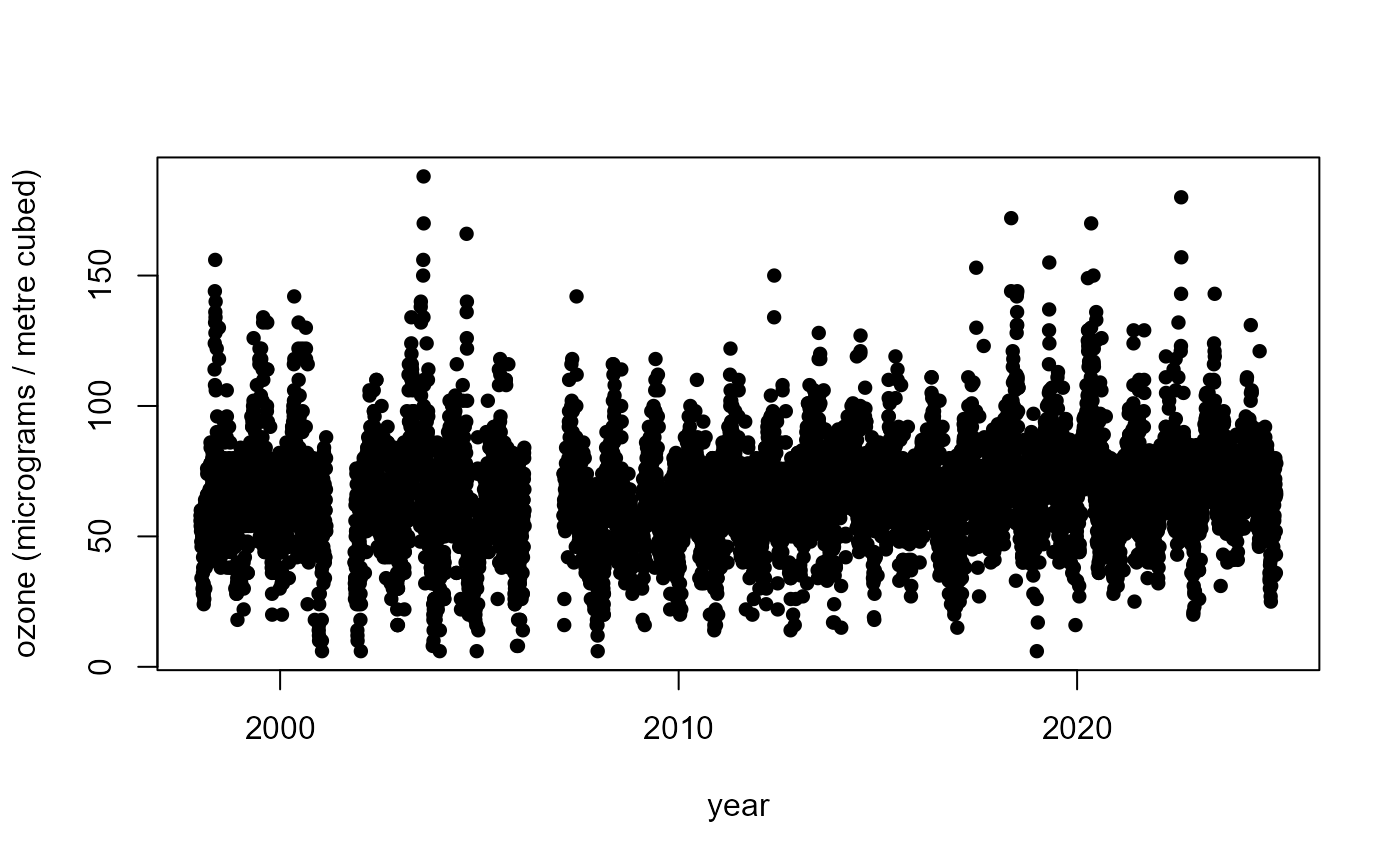
Daily maximum ozone levels at Plymouth in London (UK) for the years 1998-2024 inclusive.
Format
PlymouthOzone is a data frame with 9862 rows and the 3 variables:
Date: with class"Date"in the formatYYYY-MM-DD.Year: Values in 1998-2024.Ozone: daily maximum ozone level in \(\mu\)g/m\(^3\).
Source
The Department for Environment Food and Rural Affair (DEFRA). The Plymouth Centre monitoring site at the UK-AIR database Data Selector.
See also
PlymouthOzoneMaxima for the annual maxima and numbers of
missing values per year.
Examples
head(PlymouthOzone)
#>           Date Year Ozone
#> 95  1998-01-01 1998    56
#> 96  1998-01-02 1998    58
#> 97  1998-01-03 1998    54
#> 98  1998-01-04 1998    60
#> 99  1998-01-05 1998    58
#> 100 1998-01-06 1998    52

# Time series plot of annual maxima ozone levels
plot(PlymouthOzone$Date, PlymouthOzone$Ozone, xlab = "year",
     ylab = "ozone (micrograms / metre cubed)", pch = 16)