![]()

Nearest Neighbour Search with Variables on a Torus
What does donut do?
There are several R packages, such as RANN and nabor that find the \(k\) nearest neighbours in a dataset of specified query points, based on some metric, such as L2 or L1. The donut package considers the situation where one or more of the variables in the dataset is periodic on a finite interval. For example, direction is periodic on the interval \((0, 360)\) degrees. In the small dataset \(\{10, 90, 350\}\) degrees 350 is closer to 10 than is 90: 10 and 350 are separated by 20 degrees, 10 and 90 by 80 degrees.
The function nnt() finds the \(k\) nearest neighbours of each of a set of points of interest, wrapping periodic variables on a torus so that this periodicity is reflected. The user chooses the function to use to find the nearest neighbours. The nearest neighbour functions from the aforementioned packages are used as examples.
An example
We use a simple example from the RANN:nn2() documentation. We suppose that both variables should be wrapped, on the ranges \((0, 2\pi)\) and \((0, 3)\) respectively. We choose the query points of interest to illustrate the wrapping of the variables. In the plot, query points are indicated with colour-coded crosses and the 8 nearest neighbours of each point are shaded in the same colour. By default nnt() uses the function RANN::nn2() (based on the L2 metric) to find the nearest neighbours.
library(donut)
set.seed(20092019)
x1 <- runif(100, 0, 2 * pi)
x2 <- runif(100, 0, 3)
DATA <- data.frame(x1, x2)
ranges <- rbind(c(0, 2 * pi), c(0, 3))
query <- rbind(c(6, 1.3), c(2 * pi, 3), c(3, 1.5), c(4, 0))
library(RANN)
res2 <- nnt(DATA, query, k = 8, torus = 1:2, ranges = ranges)
plot(res2)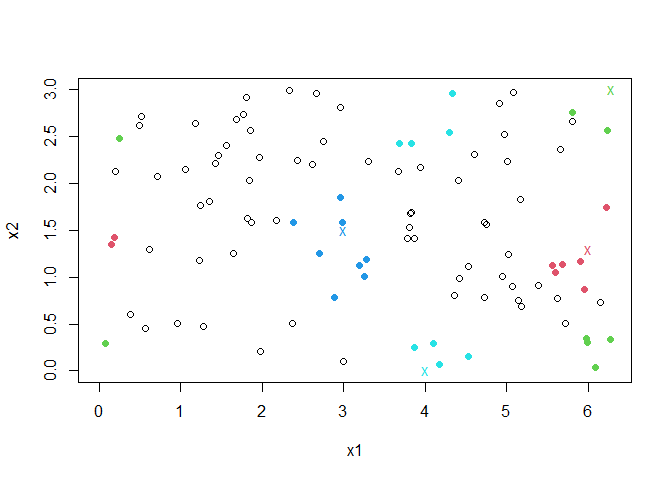
Vignette
See vignette("donut-vignette", package = "donut") for an overview of the package.