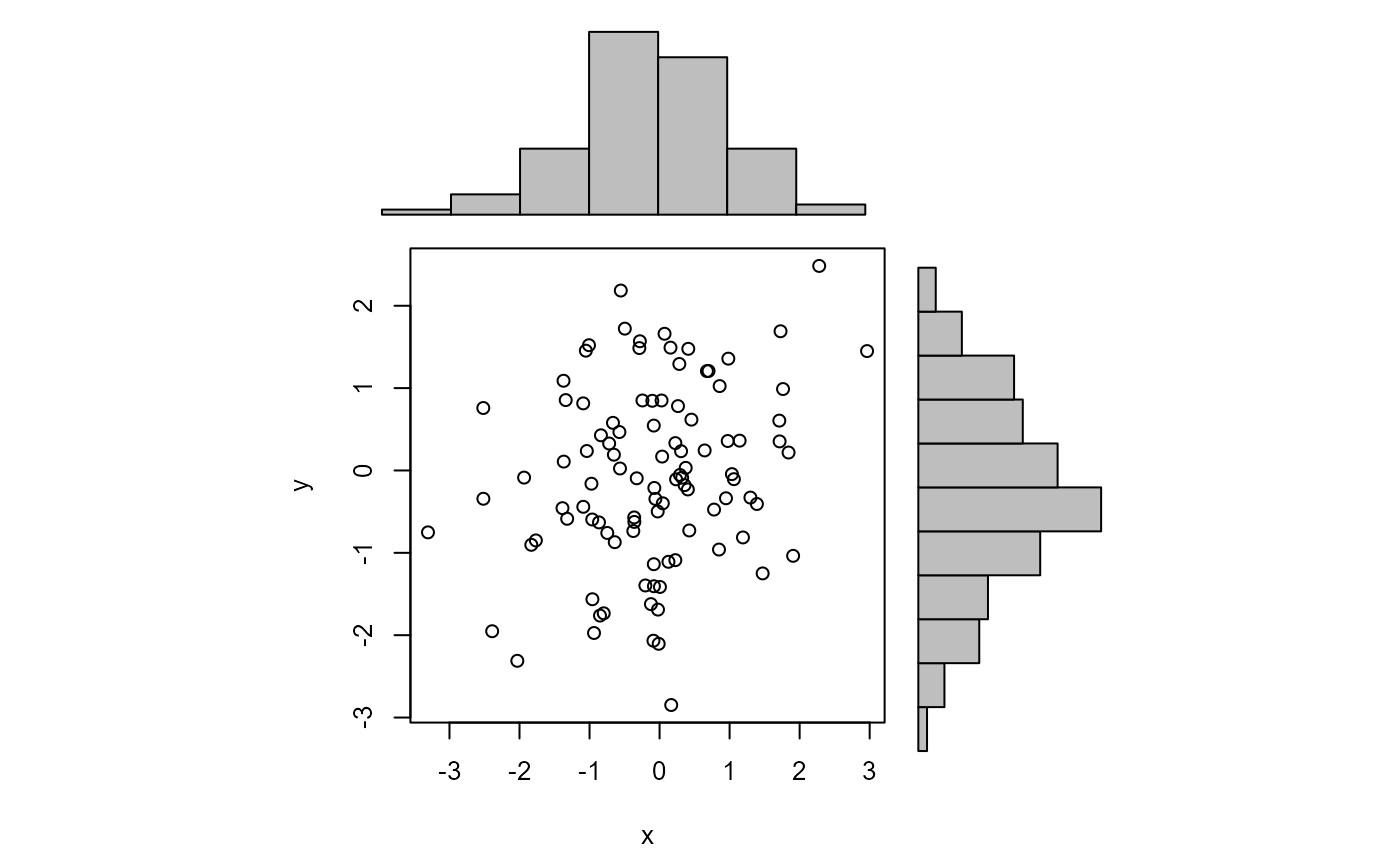
Produces a scatter plot in which the axes are supplemented by histograms of the marginal horizontal and vertical axis data.
Arguments
- x
The argument
xofplot.- y
The argument
xofplot.- xbreaks
A numeric vector. Optional argument
breakstohistwhen plotting the histogram on the horizontal axis.- ybreaks
A numeric vector. Optional argument
breakstohistwhen plotting the histogram on the vertical axis.- ...
Further arguments to be passed to
plot.