Graphical checking of Poisson process properties
Source:R/poisson_process_check_movie.R
poisson_process_check.RdA movie to perform informal graphical checks of whether event arrival times are consistent with arising from a (one-dimensional, homogeneous) Poisson process.
Usage
poisson_process_check(
  user_data = NULL,
  total_time = NULL,
  intervals = 1,
  unif_bins = NULL,
  exp_bins = NULL
)
Arguments
- user_data
A numeric vector of arrival times of events.
- total_time
A positive numeric scalar. The number of time units (for example hours) over which the events in
user_datawere recorded. Must be no smaller than the largest value inuser_data.- intervals
An integer scalar. Must not be smaller than 1. The number of intervals into which to split the time interval (0,
total_time) for the purposes of checking the property that the number of events that occur in an interval of fixed width has a Poisson distribution. Ifintervalsis not an integer then it will be rounded to the nearest integer.- unif_bins
A positive integer scalar. The number of bins to use in the histogram in the "times at which events occur" described in Details. If this is not supplied then the default number of bins used in
histis used.- exp_bins
A positive integer scalar. The number of bins to use in the histogram in the "times between events" described in Details. If this is not supplied then the default number of bins used in
histis used.
Details
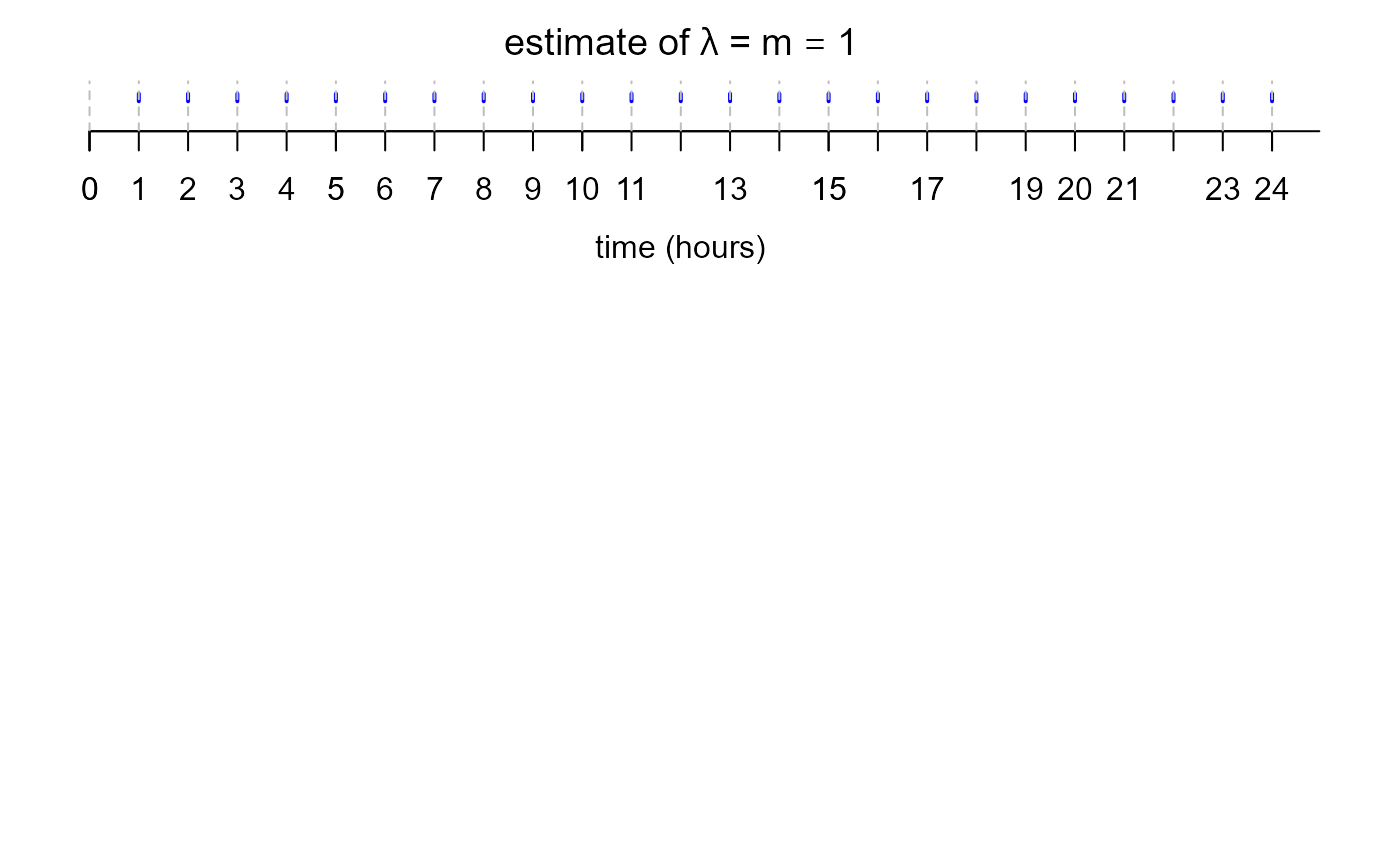
This movie contains two displays of plots: one plot on the top and
one of three other plots on the bottom. The rate, \(\lambda\) say, of
the supposed Poisson process is estimated by the sample mean number of
events over the n_intervals, that is,
length(user_data) / intervals. Let's call this estimate
\(m\).
The type of plot that appears in the bottom of the display depends on the radio click by the user. The choices are
"none": Nothing is plotted
"numbers of events in each hour": A barplot (the red bars) giving the proportions of the hours for which there are 0, 1 , 2, ... events. Also included are black bars showing the p.m.f. of a Poisson(\(m\)) random variable.
"times between events": A histogram (with red rectangles) of the sample times between events, with the p.d.f. of an exponential(\(m\)) random variable superimposed.
"times at which events occur": A histogram (with red rectangles) of the simulated event times, with the p.d.f. of a uniform(0,
hours) random variable superimposed.
The type of plot can be changed by clicking on the appropriate radio button.
See also
stat0002movies: general information about the movies.
poisson_process_movie: for similar plots based on
data simulated from a Poisson process.