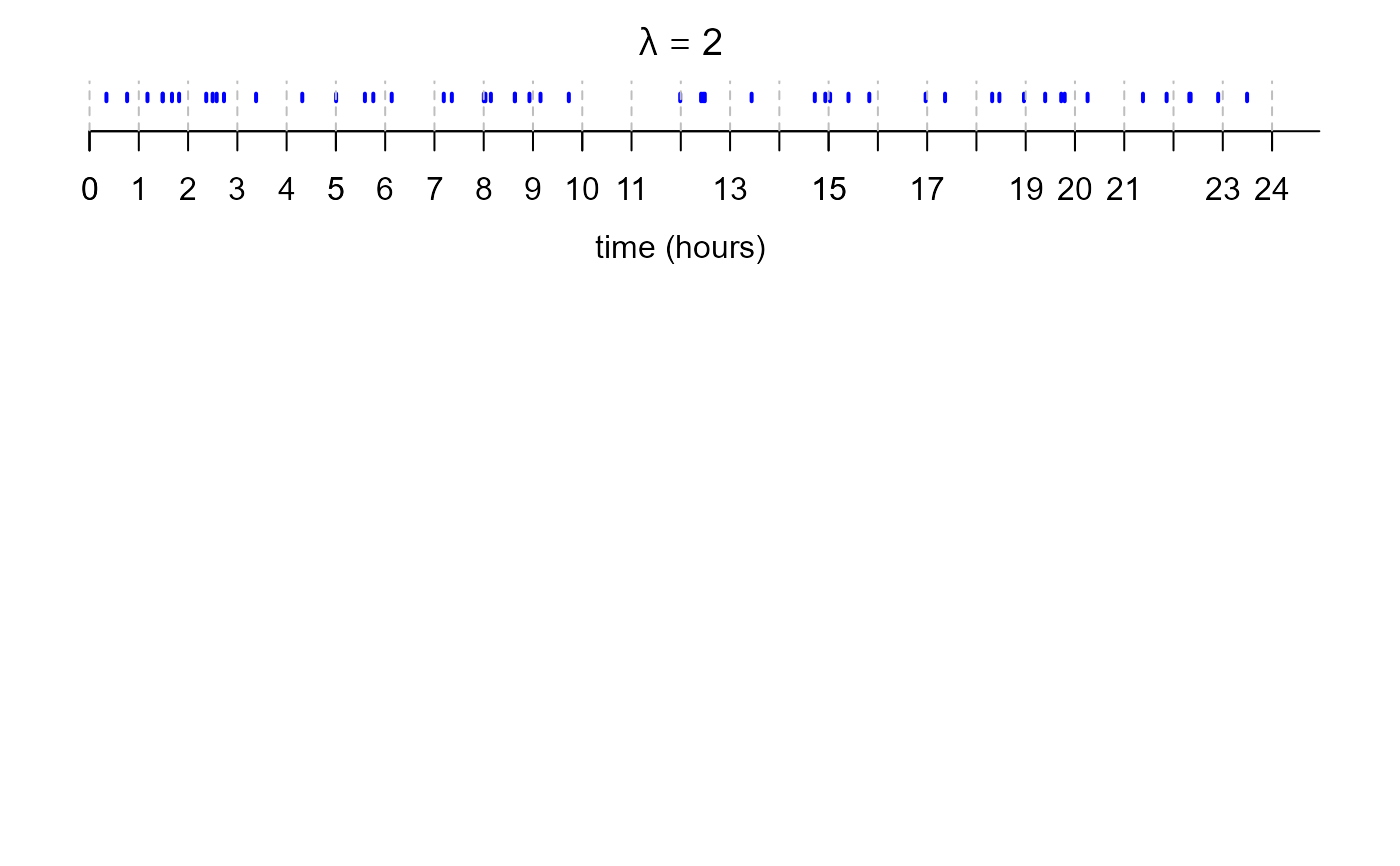
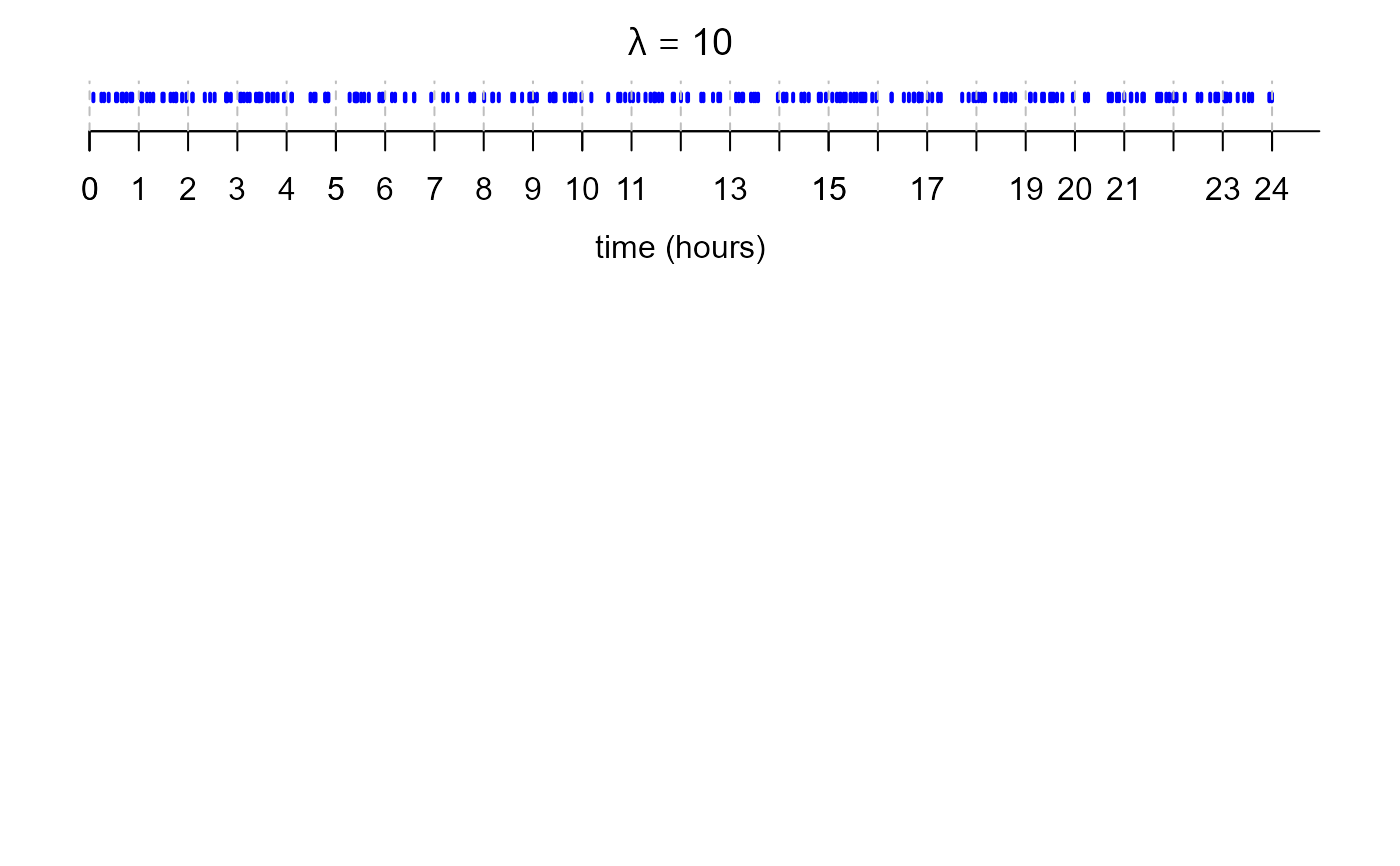
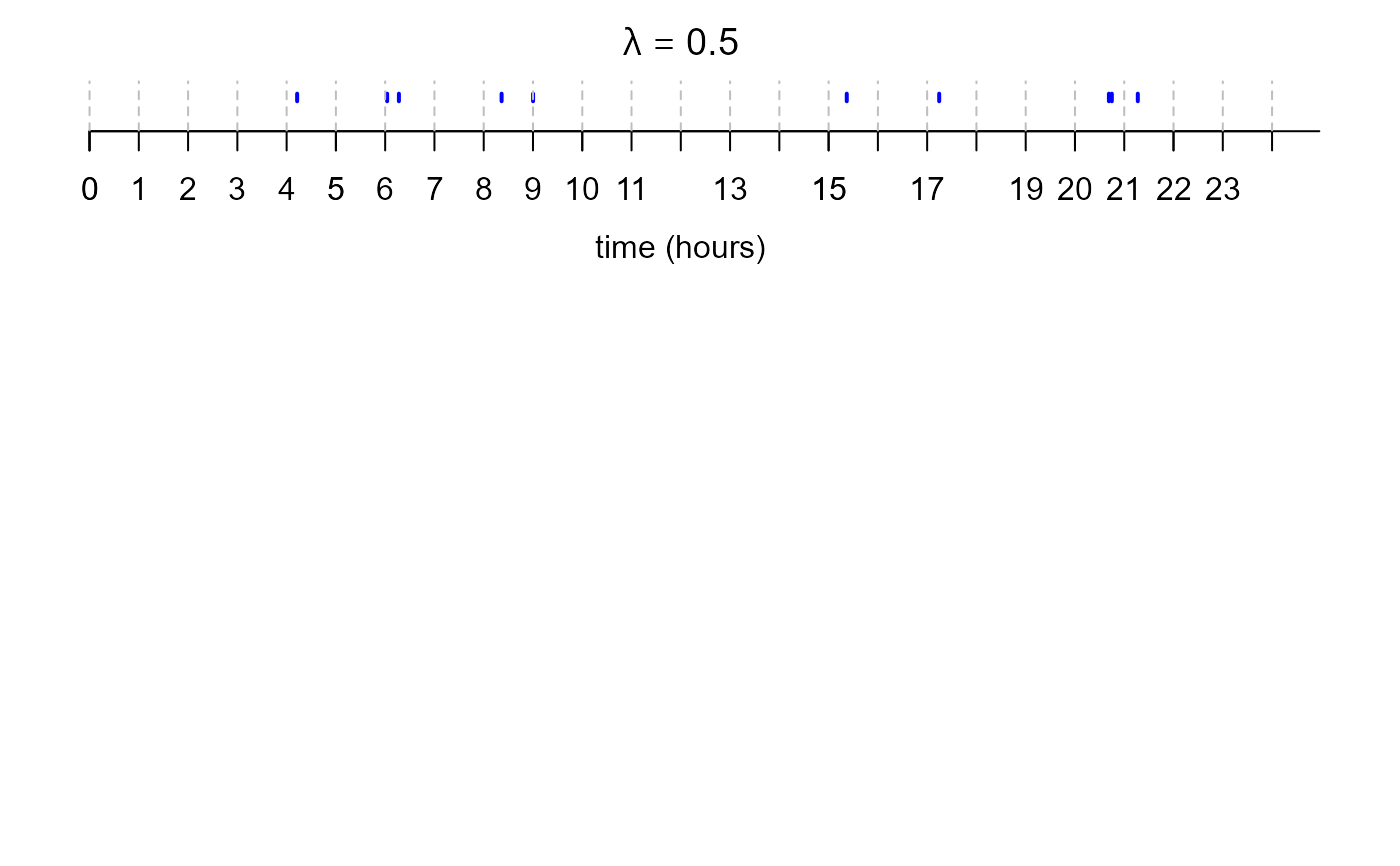
A movie to illustrate that if events arrive in a (one-dimensional, homogeneous) Poisson process of rate \(\lambda\) per hour then (a) the number of events that arrive during a fixed interval of length \(t\) hours has a Poisson distribution with mean \(\lambda t\); (b) the time between successive events has an exponential distribution with mean \(1/\lambda\); (c) the arrival times are an (ordered) random sample from a uniform distribution on the interval \((0,t)\). Data are simulated from a Poisson process to illustrate this. Alternatively, the use may supply their own arrival time data in order to assess, informally using graphs, whether or not these data seem consistent with arising from a Poisson process.
Usage
poisson_process_movie(
  lambda = 1,
  hours = 24,
  pos = 1,
  envir = as.environment(pos)
)
Arguments
- lambda
A positive numeric scalar. The rate of the Poisson process. [
lambdamust not exceed 200 because the plots in the movie are not designed to work for larger values oflambda.]- hours
A positive integer scalar. The number of hours for which to simulate a Poisson process of rate
lambdaevents per hour. For the purposes of this moviehoursmust not be smaller than 1.- pos
A numeric integer. Used in calls to
assignto make information available across successive frames of a movie. By default, uses the current environment.- envir
An alternative way (to
pos) of specifying the environment. Seeenvironment.
Details
This movie contains two displays of plots: one plot on the top and one of three other plots on the bottom.
Data are (repeatedly) simulated from a Poisson process of rate
\(\lambda\) events per hour occur during the time interval
(0, hours) hours. The total numbers of events that occur in each
hour are also displayed on the plot. Each time the button "simulate
another sequence of events" is clicked a new set of simulated events
is produced.
The type of plot that appears in the bottom of the display depends on the radio button clicked by the user. The choices are
"none": Nothing is plotted
"numbers of events in each hour": A barplot (the red bars) giving the proportions of the hours for which there are 0, 1 , 2, ... events. Also included are black bars showing the p.m.f. of a Poisson(\(\lambda\)) random variable.
"times between events": A histogram (with red rectangles) of the simulated times between events, with the p.d.f. of an exponential(\(\lambda\)) random variable superimposed.
"times at which events occur": A histogram (with red rectangles) of the simulated event times, with the p.d.f. of a uniform(0,
hours) random variable superimposed.
Each time the "simulate another sequence of events" button is clicked [or the currently-selected radio button is clicked again] then a new set of events is simulated and these event are added to the current collection of simulated events.
Note: During the early stages of the simulations the heights of the black bars in the "numbers of events in each hour" plot may be incorrect because they extend beyond the plot region.
See also
stat0002movies: general information about the movies.
poisson_process_check: for similar plots based on
data supplied by a user.